Dr. Stephen Smith’s ‘Circle of Life’/’Tree of Life’ abstract visualization: Data visualization of biological diversity
These two images represent different versions of a digital visualization created by Ecology and Evolutionary Biology Associate Professor Stephen Smith. They each promote the role of collaboration and diversity in the academic study of ecology and evolutionary biology. Smith's project, called “Tree of Life,” pools research from around the world and develops a model for academic, scientific inter-relatedness. The entire visualization features roughly 2.3 million named species of animals, plants, fungi, and microbes.


The image on the above left is a spiral design with streaks of various shades of yellow, green, and blue against a white backdrop.
The image on the above right is a spiral design with streaks of various shades of pink, purple, and blue against a white backdrop.
It was created by students and staff at the Science Learning Center (SLC).
You can explore the tree of life online for free.
The blue and green image was created by visiting high school students during a Debate summer experience on the University of Michigan campus. The multicolored image was created by Dr Smith and student members of the Science Learning Center, center at U-M that supports student learning in the natural sciences. Each illustrates the unique way that the visualization can be imagined to represent biological diversity on Earth.
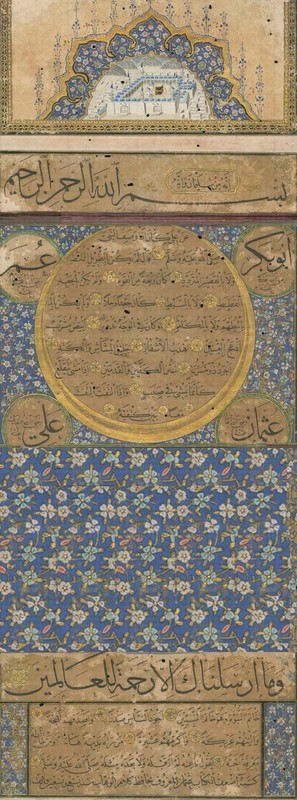
Hilye: Artistic interpretations of the Prophet Muhammad
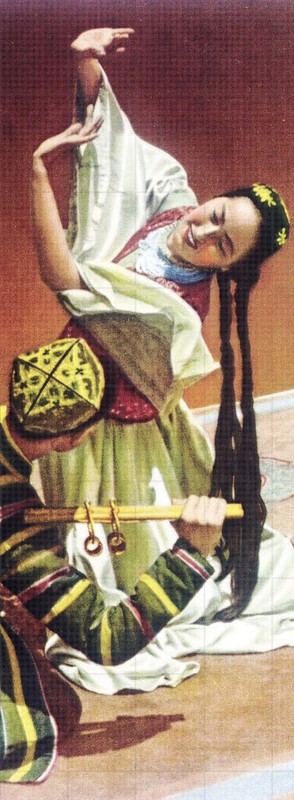
Qemberxanim: Chinese activist's dance