There are many ways to record and analyze what is happening in the University of Michigan libraries over time. The more we understand how users are engaging with our spaces, the more we can do to meet their needs. But how do you get a handle on such a big question (library space use)? What data do you collect and how do you break it down?
The Library Environments department, in partnership with our fellow Operations department colleagues, is working to tackle this question. We are using a mixed methods framework (see image below). Each method captures part of the story of our spaces, at the building, room and user level. Looked at in combination, this data can help our organization make more evidence-based decisions about how we design our spaces.
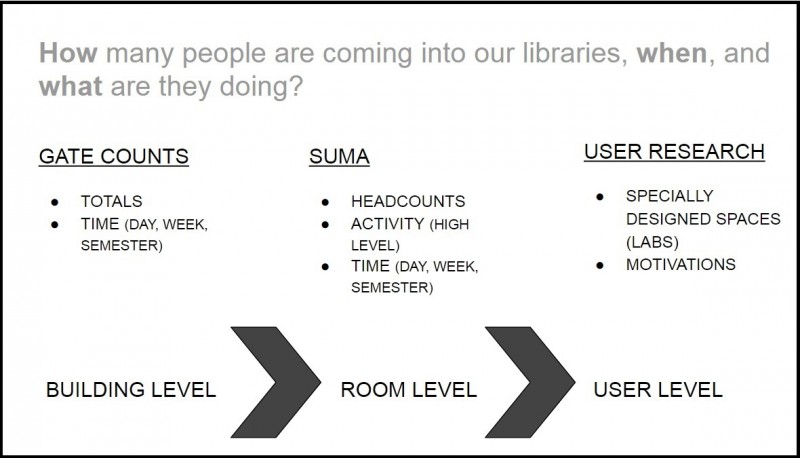
One method can't answer every question; by using a combination of methods we are able to analyze activity at different levels.
Room Level Data
One tool we use to collect observational data at the room level is called Suma. Suma is an open source tool developed by the North Carolina State University Libraries. The library has been using this tool since 2013 to capture data about our spaces. We began by collecting data in the Shapiro Undergraduate Library, and have since started doing regular data collection in nearly all of our buildings.
How do we use Suma?
Suma can be configured into initiatives, locations and activities. These configurations can be combined to collect data about all kinds of things, from headcounts to service desk interactions. At U-M, we collect data in two different ways: multiple daily headcounts; and periodic, one week counting intervals that we have coined "initiatives."
Headcounts
Operations staff members collect data about how many people are in the public spaces in the Fine Arts Library, Hatcher Graduate Library, Shapiro Undergraduate Library, Music Library, and the Art, Architecture and Engineering Library ("headcounts"). On each floor, we have defined spaces according to a set list of space descriptions that we developed (take a look at our maps for more details). Once every four hours (beginning at the opening time of each building), staff walk around their building with an iPad installed with the Suma application, selecting the different designated spaces as they go. They then tap the count button for each person that they see in that space. As staff tap, Suma stores each count with a timestamp. At the end of the session, the collected data is sent to a database where it can later be viewed, downloaded and analyzed.
Recently, we started including a noise level description per space. This data will help us better understand the different self-policed noise zones in our buildings, and could help us create more delineated noise/noise-free zones in the future. Noise zones are something that users have expressed interest in over the years, stating that it would be easier to find the right library location to study if it was more readily apparent what kind of behavior was appropriate in different areas.
Initiatives
In addition to regular headcounts in the past year, Operations staff have conducted three, one week data collecting periods, during which they input descriptions of individual and group activity. Staff add descriptions that are like short stories about what people are doing, recording information about how people are grouped, if they're talking, what furniture they're using, and what they have with them (see counting interface below).
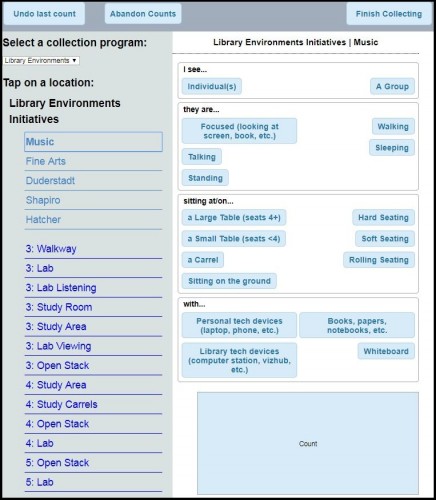
The Suma interface for initiatives.
We conducted these particular initiatives during Spring Break, Winter semester exams, and during the summer. By comparing low traffic weeks and high traffic weeks, we hope to better understand where users choose to go when they have options, and what the buildings look like at capacity. These initiatives also help us have more information about what "getting work done" looks like for users in our libraries across the semester.
What Do We Gain by Doing This Work?
With more information about high level activity, we can start to identify activity trends over time in different locations. Suma doesn't give us any information about why we see the trends we do, but from recorded trends, we can develop more focused observation- or interview-based studies that allow us to dig deeper. From there, we can use what we learn to make decisions about space configuration as well as what furniture to purchase.
Looking Forward
In 2017-2018, we have more initiatives planned as we build on our baseline of usage data. We are looking forward to uncovering more about our many different spaces and locations, all in effort to inform the design of our spaces so that they better meet the needs of our community.